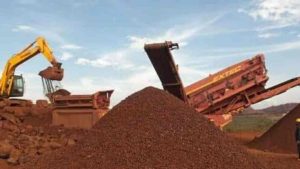
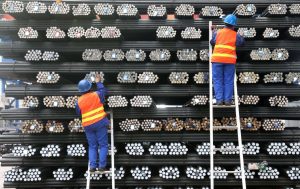
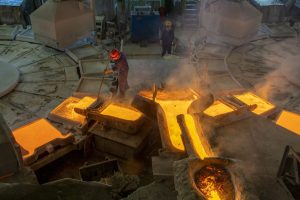
World crude steel production for the 64 countries reporting to the World Steel Association (worldsteel) was 161.7 million tonnes (Mt) in July 2021, a 3.3% increase compared to July 2020.
China produced 86.8 Mt in June 2021, down -8.4% on July 2020. India produced 9.8 Mt, up 13.3%. Japan produced 8.0 Mt, up 32.5%.
Crude steel production in the world
| Arae | July 2021 (Mt) | % change July – July 21/20 | Jan-July 2021(Mt) | % change 21/20 |
| Africa | 1.3 | 36.9 | 9.3 | 29.2 |
| Asia and Oceania | 116.4 | -2.5 | 853 | 10.9 |
| CIS | 9.2 | 11.2 | 62.5 | 9 |
| EU (27) | 13.0 | 30.3 | 90.8 | 20.1 |
| Europe, Other | 4.1 | 4.6 | 29.3 | 15.6 |
| Middle East | 3.6 | 9.2 | 25.3 | 10 |
| North America | 10.2 | 36 | 68.7 | 18.7 |
| South America | 3.8 | 19.6 | 26.4 | 26.3 |
| Total | 161.7 | 3.3 | 1,165.30 | 12.4 |
Top 10 crude steel producing countries in the world
| Countries | July 2021 (Mt) | % change July – July 21/20 | Jan-July 2021(Mt) | % change 21/20 |
| China | 86.8 | -8.4 | 649.3 | 8.0 |
| India | 9.8 | 13.3 | 68.0 | 28.7 |
| Japan | 8.0 | 32.5 | 56.1 | 16.2 |
| United States | 7.5 | 37.9 | 49.5 | 18.5 |
| Russia | 6.7 | 13.4 | 44.9 | 9.2 |
| South Korea | 6.1 | 10.8 | 41.3 | 8.7 |
| Turkey | 3.0 | 24.7 | 23.6 | 18.9 |
| Germany | 3.2 | 2.5 | 22.9 | 17.7 |
| Brazil | 3.0 | 14.5 | 21.0 | 22.0 |
| Iran | 2.6 | 9.0 | 17.8 | 9.9 |
Arab countries’ production of crude steel
| Countries | July 2021 (000t) | July 2020 (000t) | % change 21/20 |
| Egypt | 753 | 534 | 41.0% |
| Saudi Arabia | 760 | 691 | 9.9% |
| United Arab Emirates | 241 | 229 | 5.2% |
| Qatar | 93 | 78 | 19.2% |
| Libya | 55 | 15 | 266% |


