


According to preliminary data announced by the World Steel Organization on world production (63 countries) in July 2023, crude steel production amounted to 158.5 Mt , a 6.6% increase compared to production in July 2022.
Africa produced 1.4 Mt in July 2023, up 26.1% on July 2022. Asia and Oceania produced 119.9 Mt, up 9.1%.
The EU (27) produced 10.3 Mt, down 7.1%. Europe, Other produced 3.6 Mt, up 5.1%. The Middle East produced 3.1 Mt, down 3.9%.
North America produced 9.4 Mt, down 1.2%. Russia & other CIS + Ukraine produced 7.4 Mt, up 9.3%. South America produced 3.4 Mt, down 8.4%.
Production in different regions of the world
| Region | July 2023
(MT) |
% July changes 22/23 | Jan-July 2023
(MT) |
% Changes 22/23 |
| Africa | 1.4 | 26.1 | 9.0 | 7.0 |
| Asia Oceania | 119.9 | 9.1 | 828.4 | 1.7 |
| EU | 10.3 | -7.1 | 76.7 | -10.3 |
| Other Europe | 3.6 | 5.1 | 23.8 | -11.7 |
| Middle East | 3.1 | -3.9 | 26.2 | 2.3 |
| North America | 9.4 | -1.2 | 64.1 | -3.5 |
| CIS group | 7.4 | 9.3 | 51.2 | -0.8 |
| South America | 3.4 | -8.4 | 23.7 | -7.4 |
| Total | 158.5 | 6.6 | 1,103.2 | -0.1 |
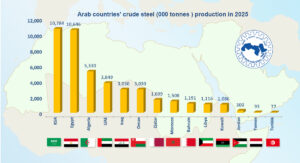
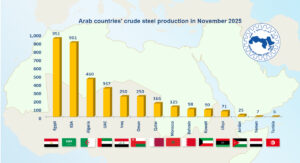
As for the Arab countries, Egypt topped the production of Arab countries in July 2023, producing 855,000 tonnes, a up 4.0%, followed by the Kingdom of Saudi Arabia, producing 810,00 tonnes, a decline of 5.2%. The UAE came in third place, producing 240,000 tonnes, a decline of 19.2%.
Arab countries Crude steel production
| Country | June 2023
(000 tonnes) |
% July changes 22/23 | Jan-July 2023
(MT) |
% Changes 22/23 |
| Egypt | 855 | 20.8% | 5622 | 2.0% |
| Saudi Arabia | 810 | -5.2% | 5459 | 0.1% |
| Emirates | 240 | -19.2% | 1689 | -10.0% |
| Qatar | 102 | 4.1% | 669 | 4.2% |
| Libya | 64 | 276.5% | 468 | 18.8% |
| Tunisia | 8 | 14.3% | 55 | 14.6% |
| Total | 2079 | 4.9% | 13962 | 0.2% |