


The Egyptian rebar market witnessed fluctuations in production and sales in the first half of 2025, amidst local economic pressures and changes in demand and prices. The following are the most prominent indicators recorded in this period:
First: Domestic Rebar Production
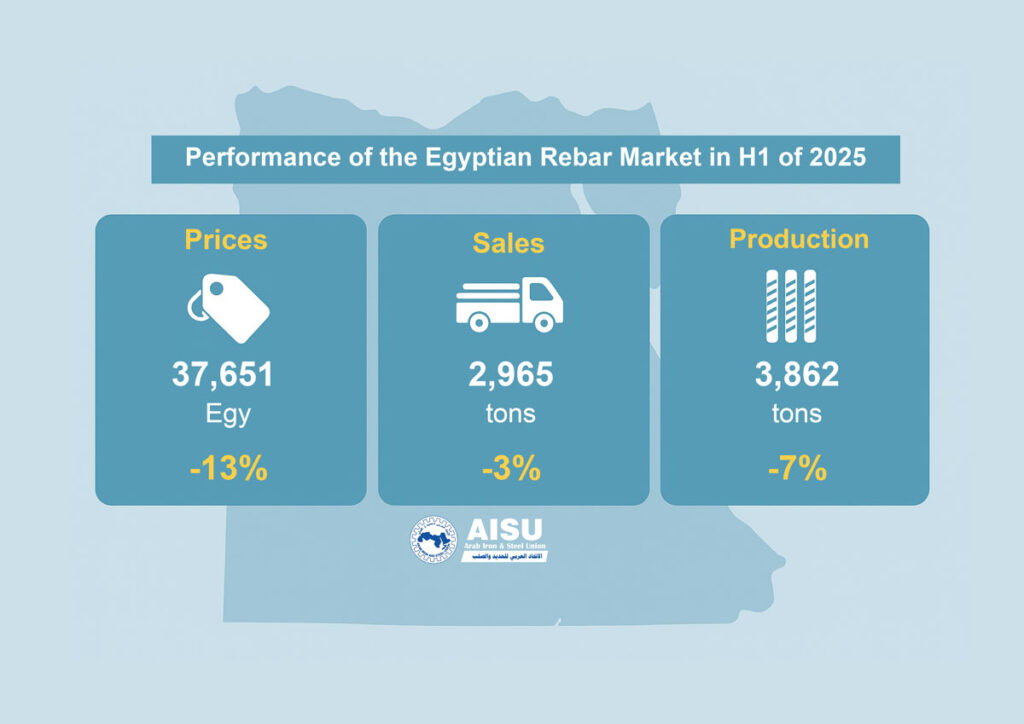
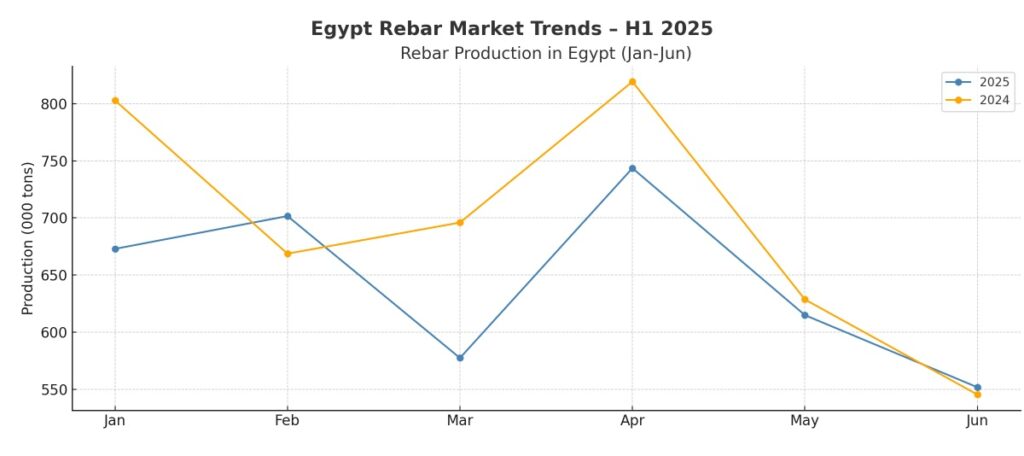
Egypt’s total rebar production in the period from January to June 2025 amounted to approximately 3.86 million tons, compared to 4.16 million tons in the same period last year, a 7% decrease.
The highest monthly production was recorded in April, at 743,500 tons.
The lowest was in June, at 551,800 tons.
On a monthly basis, performance varied, with March recording the highest annual decline of -17%, while February achieved an annual growth of 5%.
Egypt’s Rebar Production in January-June 2025
| Month | 2025 | 2024 | Change |
| January | 672.9 | 802.8 | -16% |
| February | 701.6 | 668.7 | 5% |
| March | 577.4 | 695.9 | -17% |
| April | 743.5 | 819.2 | -9% |
| May | 614.9 | 628.6 | -2% |
| June | 551.8 | 545.4 | 1% |
| Total | 3,862.1 | 4,160.6 | -7% |
Second: Domestic Rebar Sales
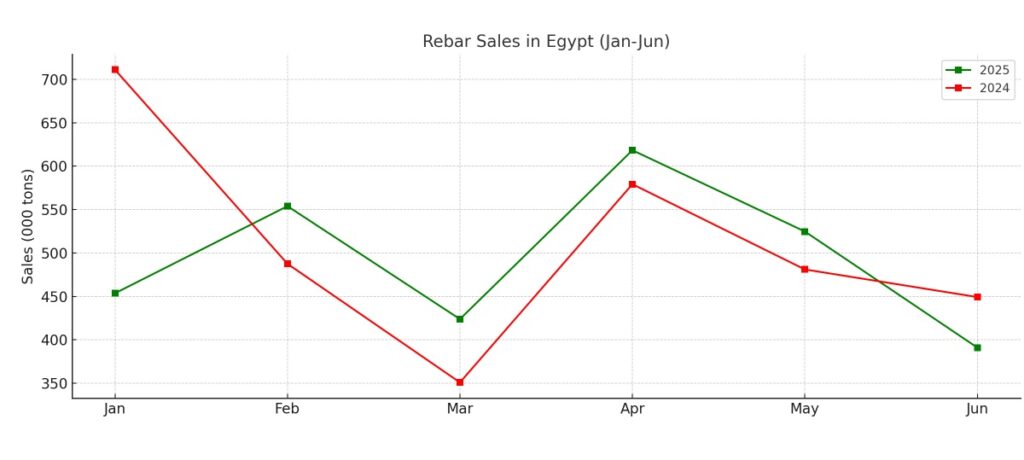
Domestic market sales in the same period recorded 2.97 million tons, compared to 3.06 million tons in the corresponding period of 2024, a slight decrease of -3%.
January saw the largest decline in sales, at -36%.
In contrast, March achieved a 21% year-on-year sales growth.
A gradual improvement in business performance is observed in April and May.
Egypt’s Rebar Sales from January to June 2025
| Month | 2025 | 2024 | Change |
| January | 453.7 | 711.1 | -36% |
| February | 554 | 487.6 | 14% |
| March | 423.9 | 351 | 21% |
| April | 618.4 | 579.3 | 7% |
| May | 524.8 | 481.1 | 9% |
| June | 391.1 | 449.3 | -13% |
| Total | 2,965.9 | 3,059.4 | -3% |
Third: Development of Average Domestic Selling Prices
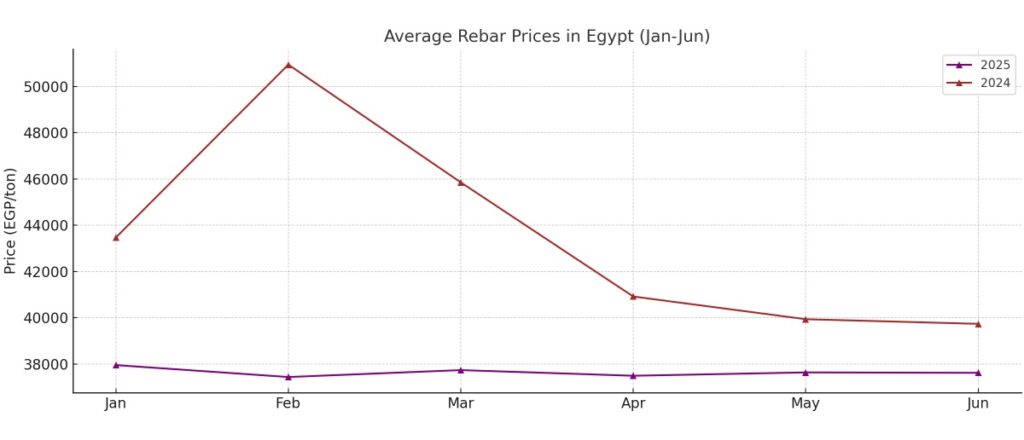
Average rebar prices decreased in the first half of 2025 to EGP 37,651 per ton, compared to EGP 43,477 in the same period in 2024, representing a 13% annual decline.
Prices recorded the largest year-on-year difference in February, a decrease of -26%.
Despite this decline, prices remained relatively stable in May and June, with a slight decline of no more than 5-6%.
Average Rebar Prices in Egypt in January – June 2025
| Month | 2025 | 2024 | Change |
| January | 37,958 | 43,469 | -13% |
| February | 37,443 | 50,939 | -26% |
| March | 37,742 | 45,851 | -18% |
| April | 37,498 | 40,921 | -8% |
| May | 37,642 | 39,941 | -6% |
| June | 37,624 | 39,740 | -5% |
| Average | 37,651 | 43,477 | -13% |
The performance of the rebar market in Egypt in the first half of 2025 reflects clear challenges on the production side, offset by relative stability in sales, with a move toward adjusting prices to match demand levels and purchasing power in the local market.
Data indicates relative market resilience despite economic conditions, and the coming months may reflect positive indicators if sales continue to improve and prices remain stable.