


World crude steel production for the 71 countries reporting to the World Steel Association (worldsteel) was 148.1 million tonnes (Mt) in January 2024, a 1.6% decrease compared to January 2023.
Crude steel production by region
| Area | Jan 2024 (Mt) | % change Jan 24/23 | Jan-Jan 2024 (Mt) |
% change 24/23 |
| Africa | 2.0 | 16.3 | 2.0 | 16.3 |
| Asia and Oceania | 107.6 | -3.6 | 107.6 | -3.6 |
| EU (27) | 10.2 | -1.8 | 10.2 | -1.8 |
| Europe, Other | 3.9 | 22.5 | 3.9 | 22.5 |
| Middle East | 4.7 | 23.1 | 4.7 | 23.1 |
| North America | 9.2 | -2.1 | 9.2 | -2.1 |
| CIS | 7.2 | 4.0 | 7.2 | 4.0 |
| South America | -6.3 | 6.3 | 3.4 | -6.3 |
| Total | 148.1 | -1.6 | 148.1 | -1.6 |
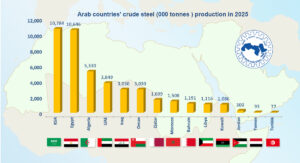
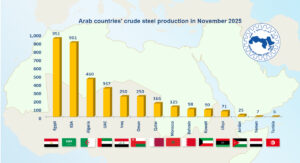
At the level of Arab countries, Egypt topped the production of Arab countries in January 204, producing 980 thousand tons, an increase of 20.7%. Followed by Saudi Arabia, with a production of 902 thousand tons, an increase of 8.2%. Algeria came in third place, producing 375 thousand tons, an increase of 1.1%.
At the level of the total production of Arab countries in January 2024, it increased by 11.5% to 3,281 thousand tons.
Arab countries’ production of crude steel
| Country | Jan -24
(thousand tons) |
% change Jan 24/23 | Jan-Jan 2024
(thousand tons) |
% change 24/23 |
| Egypt | 980 | 20.7 | 980 | 20.7 |
| Algeria | 375 | 1.1 | 375 | 1.1 |
| Morocco | 120 | 4.3 | 120 | 4.3 |
| Tunisia | 5 | -37.5 | 5 | -37.5 |
| Libya | 102 | 30.8 | 102 | 30.8 |
| Saudi Arabia | 902 | 8.2 | 902 | 8.2 |
| UAE | 350 | 7.0 | 350 | 7.0 |
| Oman | 250 | 19.0 | 250 | 19.0 |
| Qatar | 104 | 8.7 | 104 | 8.7 |
| Bahrain | 100 | 3.1 | 100 | 3.1 |
| Kuwait | 83 | -1.2 | 83 | -1.2 |
| Jordan | 25 | 4.2 | 25 | 4.2 |
| Iraq | 250 | 0.0 | 250 | 0 |
| Yemen | 10 | 25.0 | 10 | 25 |
| Total | 3,281 | 11.5% | 3,281 | 11.5% |