


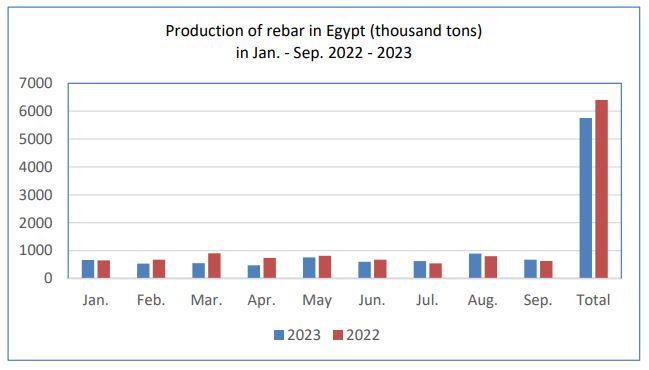
According to data collected from the Arab Iron and Steel Union, Egypt’s production of rebar during the period from January to September of this year amounted to 5.753 million tons, a decline of 10.2% compared to the same period last year, which amounted to 6.405 million tons. The first half of this year witnessed a decline of 19.6%, while the third quarter of this year witnessed an improvement of 11.2%.
Rebar production in Egypt (thousand tons) in the period January-September 2022-2023
| Year | Jan. | Feb. | Mar. | Apr. | May | Jun. | Jul. | Aug. | Sep. | Total |
| 2023 | 660 | 534 | 549 | 474 | 754 | 597 | 623 | 890 | 673 | 5,753 |
| 2022 | 646 | 672 | 901 | 737 | 812 | 672 | 541 | 800 | 625 | 6,405 |
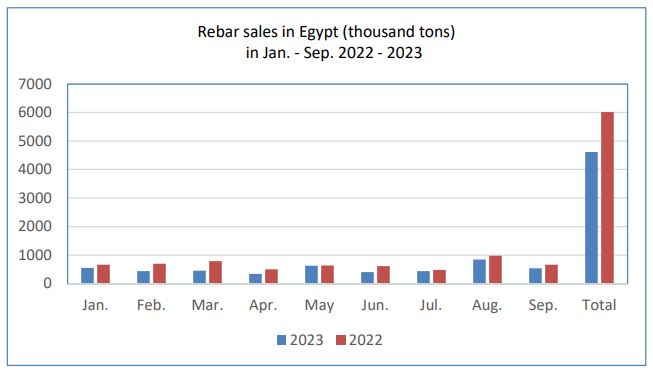
While Egypt’s sales of rebar during January-September of 2023 amounted to about 4.615 million tons, a decline of 23.3% compared to the same period last year, in which sales amounted to 6.017 million tons as a result of a decline in demand due to high inflation, and as the first half of this year witnessed a noticeable decline. Sales volume reached 28.3%, with a relative improvement in sales for the third quarter of this year, but a decrease of 14.2% compared to the same period last year. .
Rebar sales in Egypt (thousand tons) in the period January – September 2022-2023
| Year | Jan. | Feb. | Mar. | Apr. | May | Jun. | Jul. | Aug. | Sep. | Total |
| 2023 | 547 | 435 | 448 | 338 | 623 | 405 | 440 | 843 | 537 | 4,615 |
| 2022 | 659 | 696 | 790 | 503 | 633 | 615 | 478 | 979 | 664 | 6,017 |
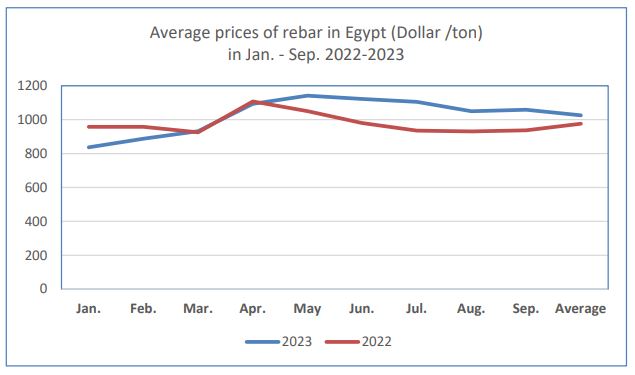
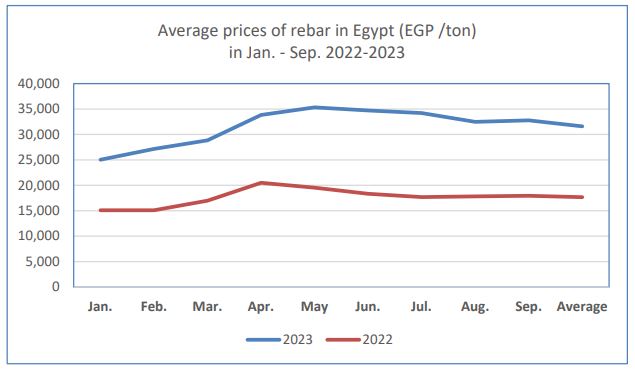
The average price of rebar in the period from January to September 2023 was about EGP 31,599 ($1,025), an increase of 78.8% (5% in relation to the value of the dollar) compared to the average price during the same period in 2022. This is due to the increase in prices in local currency compared to 2022. To increase the dollar exchange rate in Egypt from EGP 15.70 to EGP 30.90 in 2023.
Average prices of rebar in Egypt (EGP /ton) in the period January – September 2022-2023
| Year | Jan. | Feb. | Mar. | Apr. | May | Jun. | Jul. | Aug. | Sep. | Average |
| 2023 | 25,041 | 27,154 | 28,838 | 33,832 | 35,341 | 34,725 | 34,209 | 32,484 | 32,771 | 31,599 |
| 2022 | 15,104 | 15,104 | 16,968 | 20,493 | 19,537 | 18,327 | 17,678 | 17,819 | 17,945 | 17,664 |
Average prices of rebar in Egypt ($/ton) in the period January – September 2022-2023
| Year | Jan. | Feb. | Mar. | Apr. | May | Jun. | Jul. | Aug. | Sep. | Average |
| 2023 | 837 | 887 | 932 | 1,093 | 1,142 | 1,122 | 1,105 | 1,050 | 1,059 | 1,025 |
| 2022 | 958 | 958 | 926 | 1,108 | 1,050 | 980 | 935 | 930 | 937 | 976 |